District’s Current Drought Status: Stage 3 Exceptional
While April’s overall temperature was above average, it was also our first month with above average rainfall since July of 2025. April was 3.1°F hotter than normal and brought four days with a high of 90°F or above. April is normally our 10th wettest month, and this year it brought almost as much rain as our wettest month (May). This rainfall greened up the landscape and resulted in an incline in springflow, groundwater levels, and creek flow. We will need to get above average rainfall to continue this positive trajectory and prevent a Stage 4 Emergency declaration this summer.
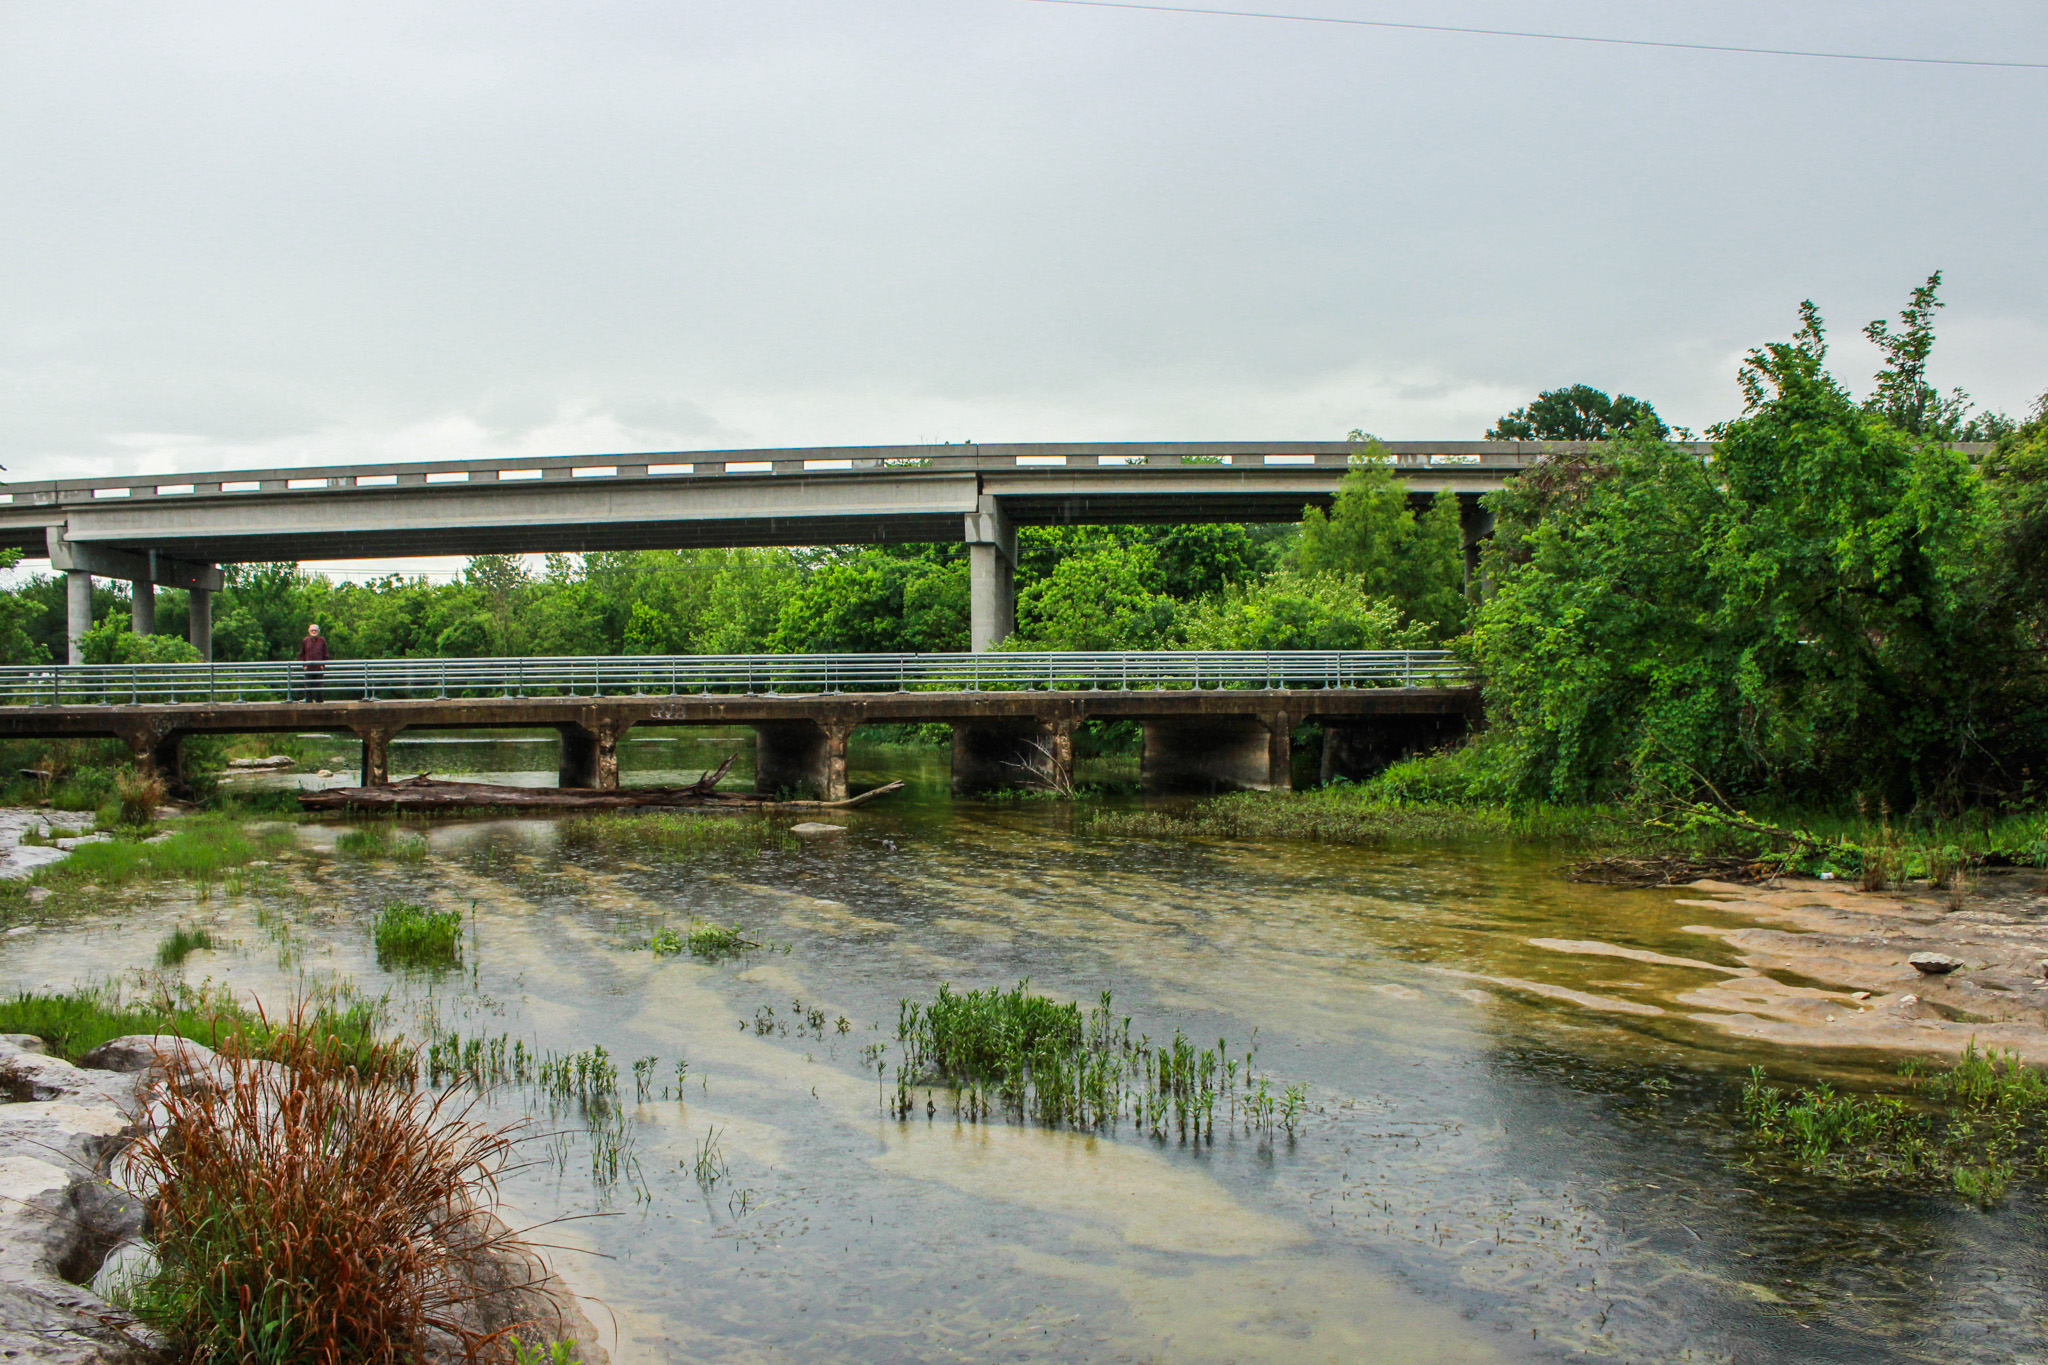
Rainy photo of Onion Creek under Old San Antonio Road | April 2026
Rainfall
April brought 4.9 inches of rainfall between Camp Mabry and ABIA – roughly 2.5 inches above the long-term monthly average (Figure 1). This marks the first month with above average rain in 10 months.
Several area creeks over the recharge zone, including Bear and Williamson, experienced short-lived flow pulses. Even Jacob’s Well showed a small response, indicating some recharge to the Trinity Aquifer.
May is typically Central Texas’ wettest month, averaging about 5 inches of rainfall. As of May 6, the region has received approximately 2 inches. While this rain produced only brief flows in local creeks, it significantly improved soil moisture across the recharge zone. With the soil now more saturated, additional rainfall later this month will have a better chance of becoming runoff, recharging aquifers, and boosting groundwater levels.
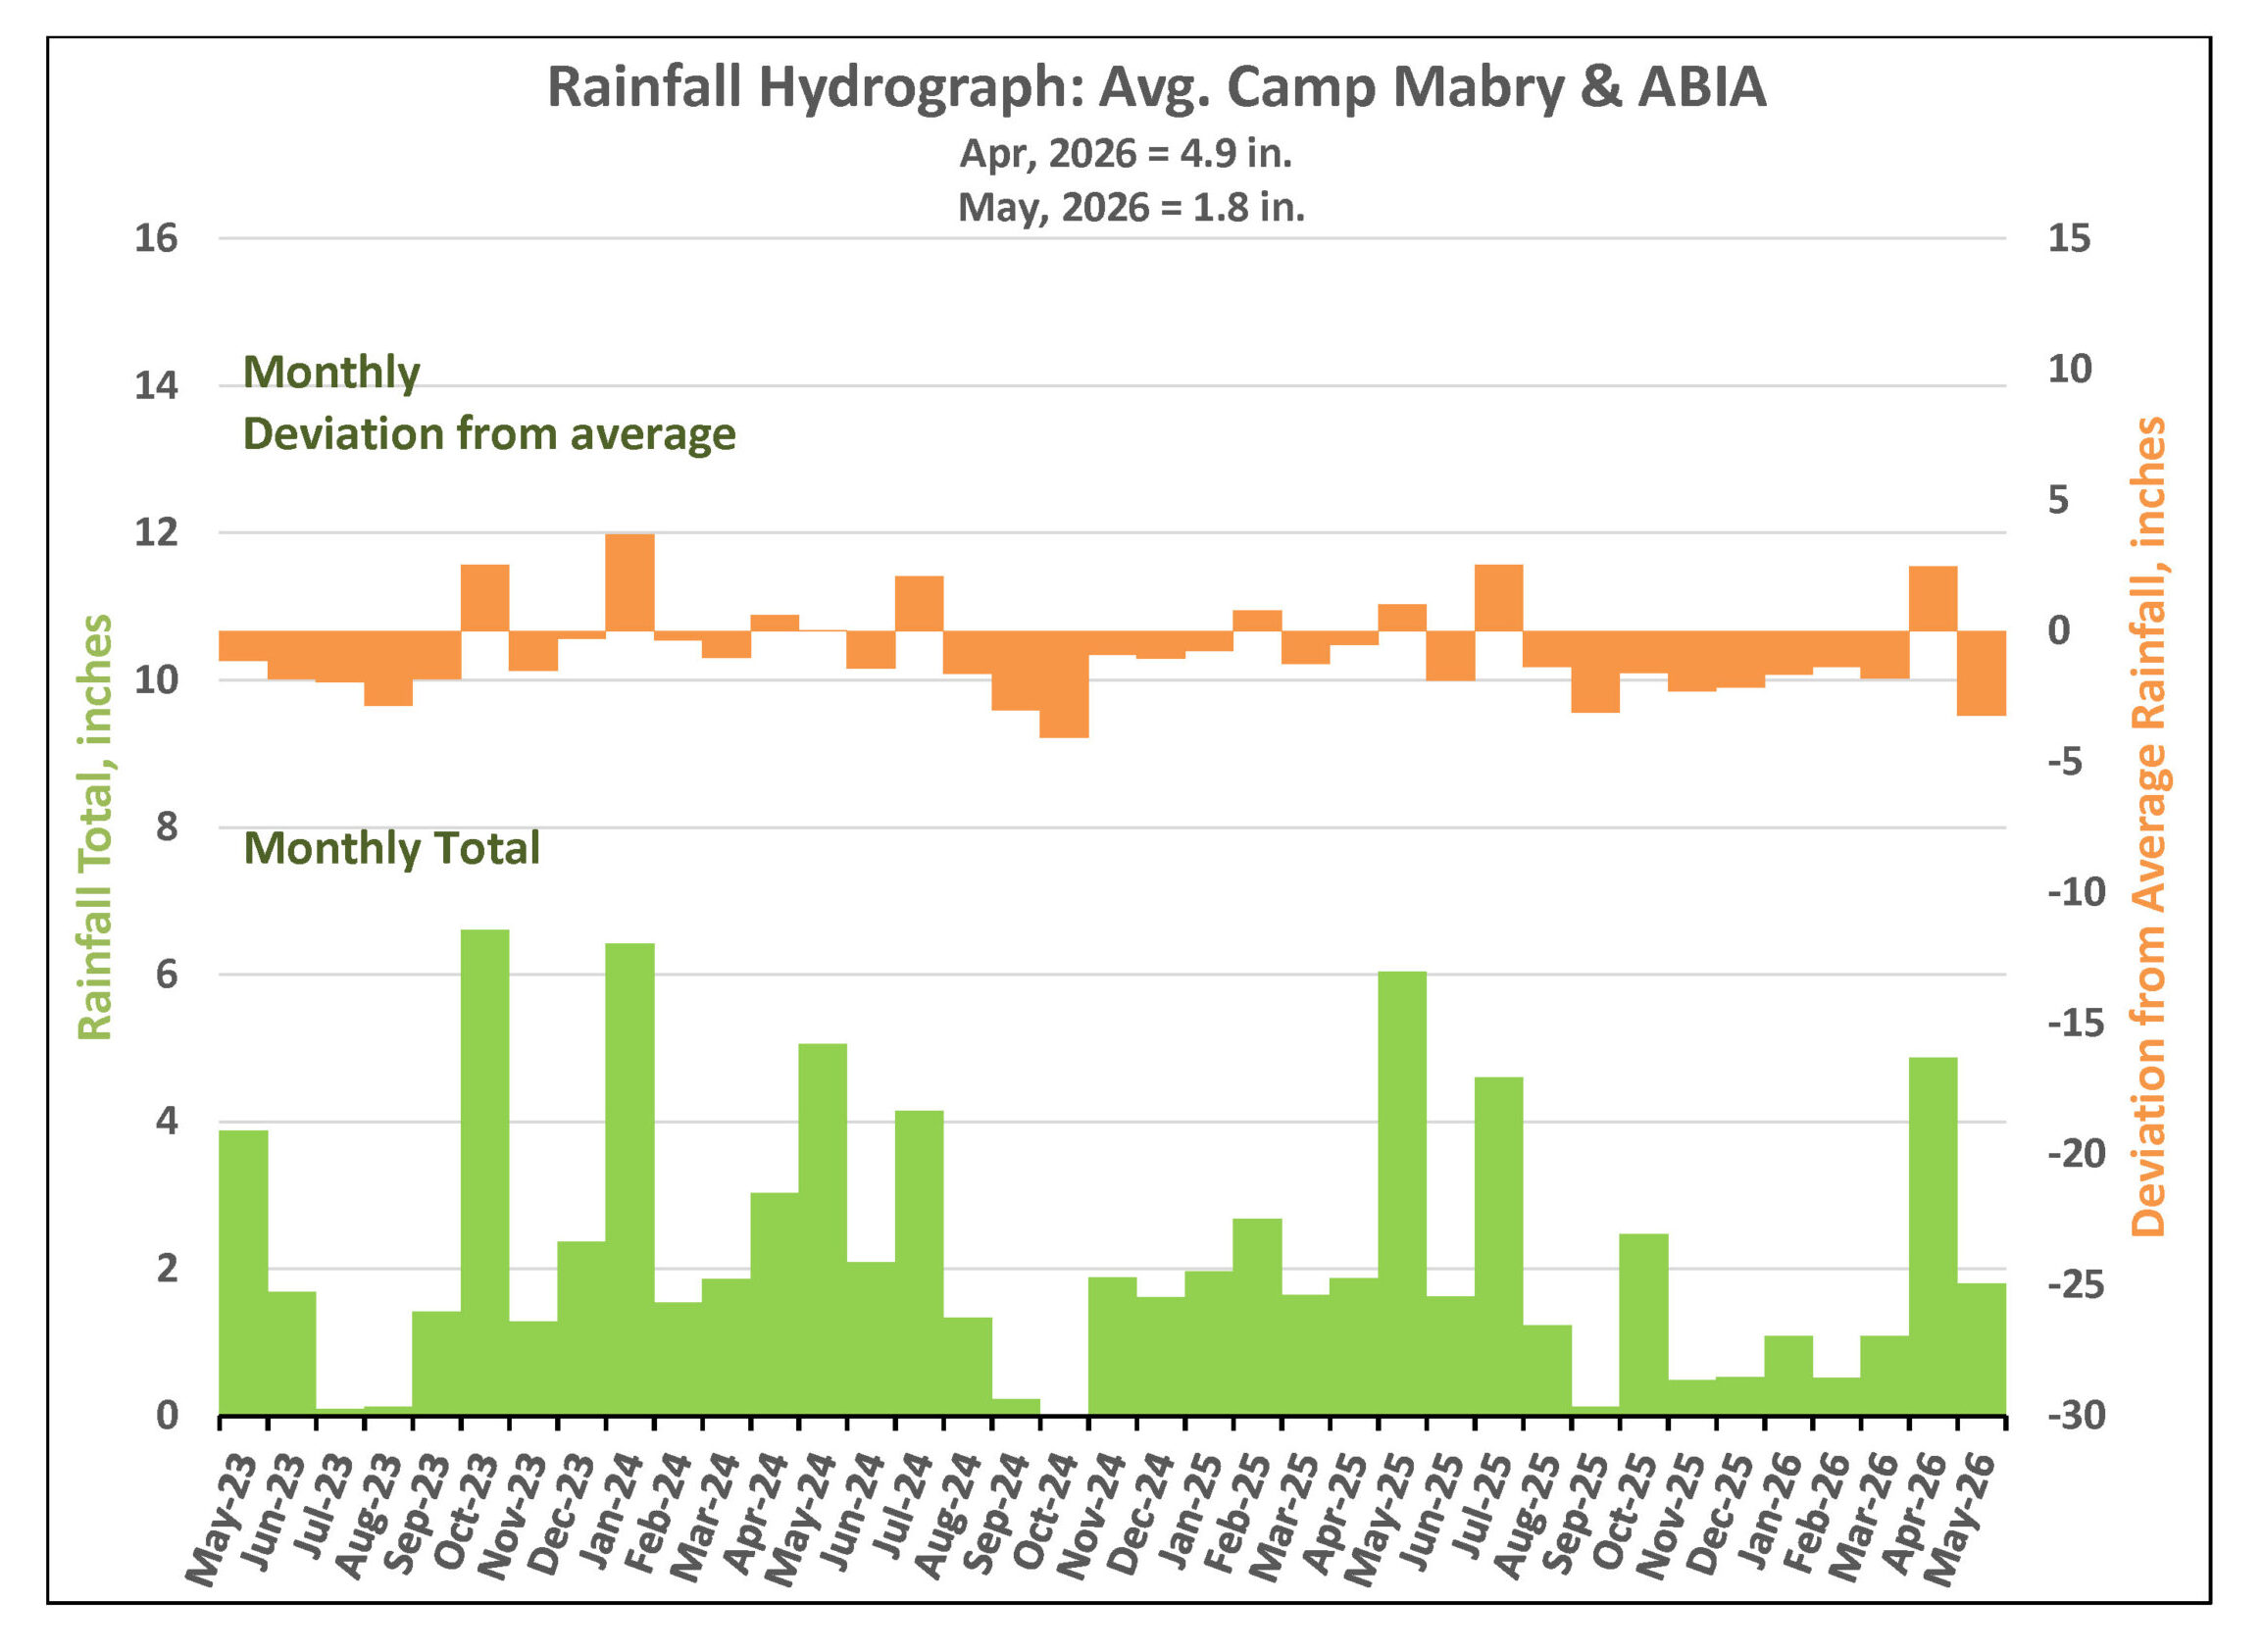
Figure 1. Monthly deviation from average and monthly total rainfall in the District’s territory.
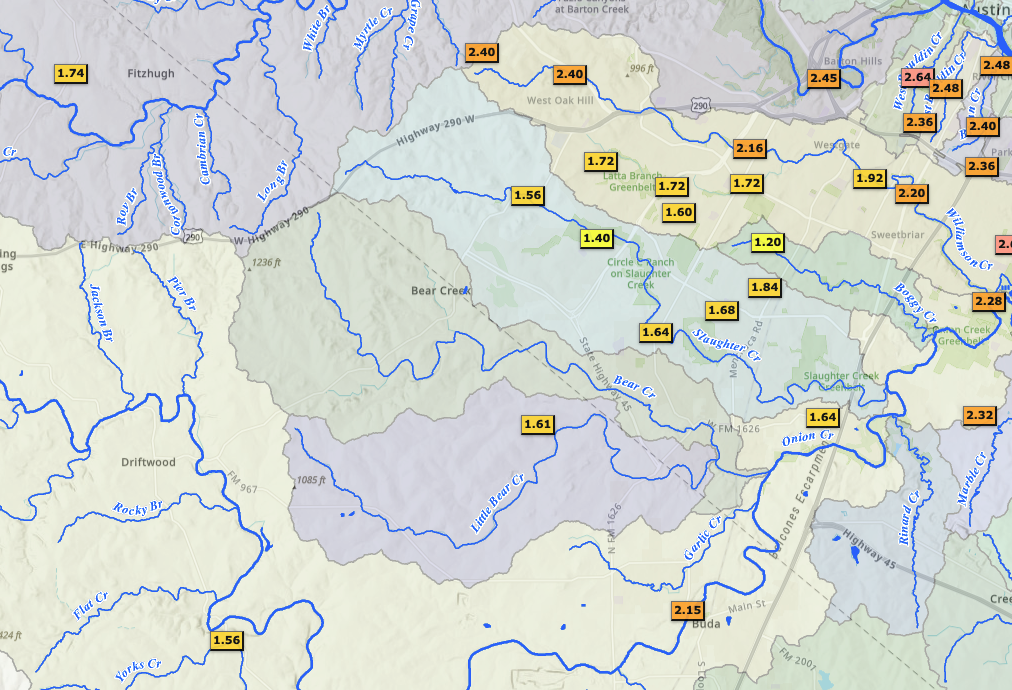
Figure 2. Rainfall over the last seven days from Austin to Dripping Springs based on the LCRA’s Hydromet.
Water Levels and Springflow
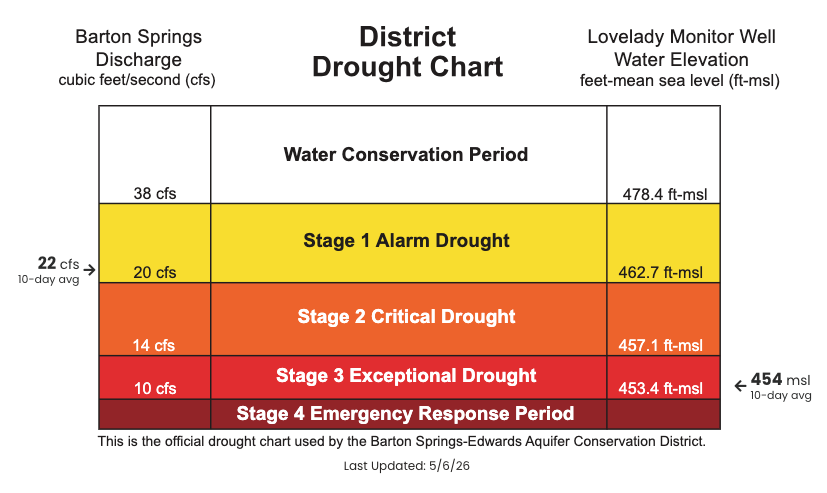
Figure 3. District drought chart showing the 10-day averages for Barton Springs flow and Lovelady monitor well water levels.
Barton Springs
As of May 6, the 10-day average discharge at Barton Springs is 22 cubic feet per second (cfs). According to the USGS gauge, springflow responded to recent rainfall and peaked at 29 cfs (up from 15 cfs on April 9) (Figure 4). Springflow at Barton Springs usually responds quickly due to conduit flow – flow that moves rapidly through larger cave-like channels. Although this increase temporarily slowed down the decline toward more severe drought conditions, it was not large enough or sustained for a long enough time to reverse the overall downward trend.
The District has never entered Stage 4 Emergency Response. However, without substantial additional recharge, springflow could approach that threshold in the coming months.
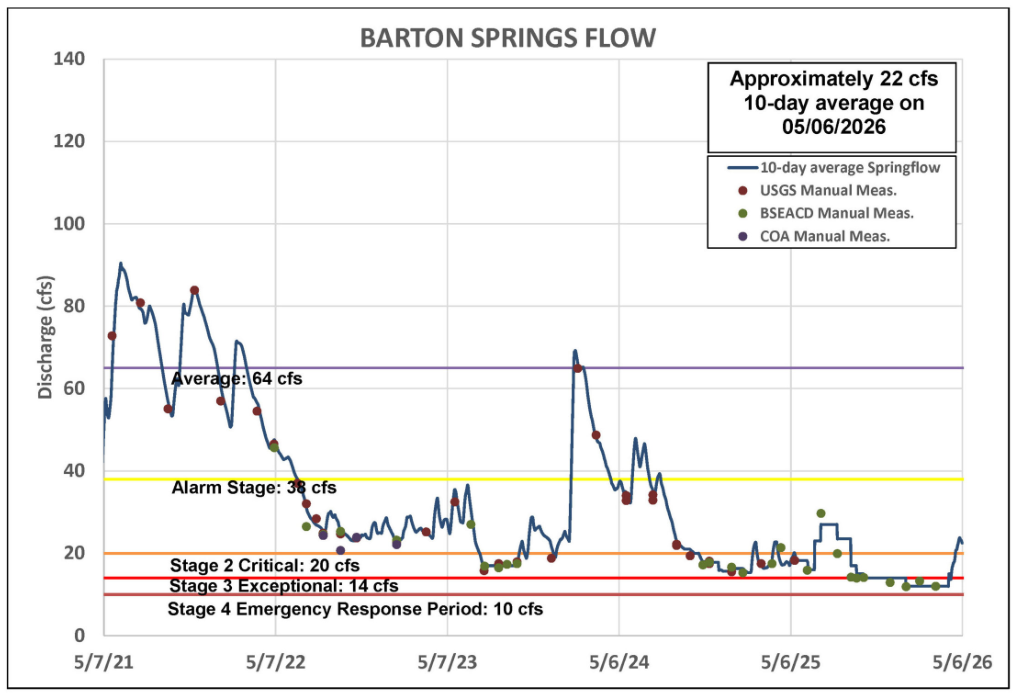
Figure 4. Recorded flow at Barton Springs over the last five years.
Lovelady Monitor Well
As of May 6, the 10-day average water level at the Lovelady monitor well is 454.0 feet above mean sea level (ft-msl), a slight increase from 453.8 ft-msl on April 9 (Figure 5). Water levels at Lovelady typically have a more delayed response to rainfall and recharge events due to more diffuse flow – flow that moves slowly through tiny cracks and pores in the rock. The continued rise is a positive sign, and if sustained, could help delay entry into Stage 4 restrictions into late summer. This will depend on rainfall patterns and pumping rates of the aquifer over the weeks and months ahead.
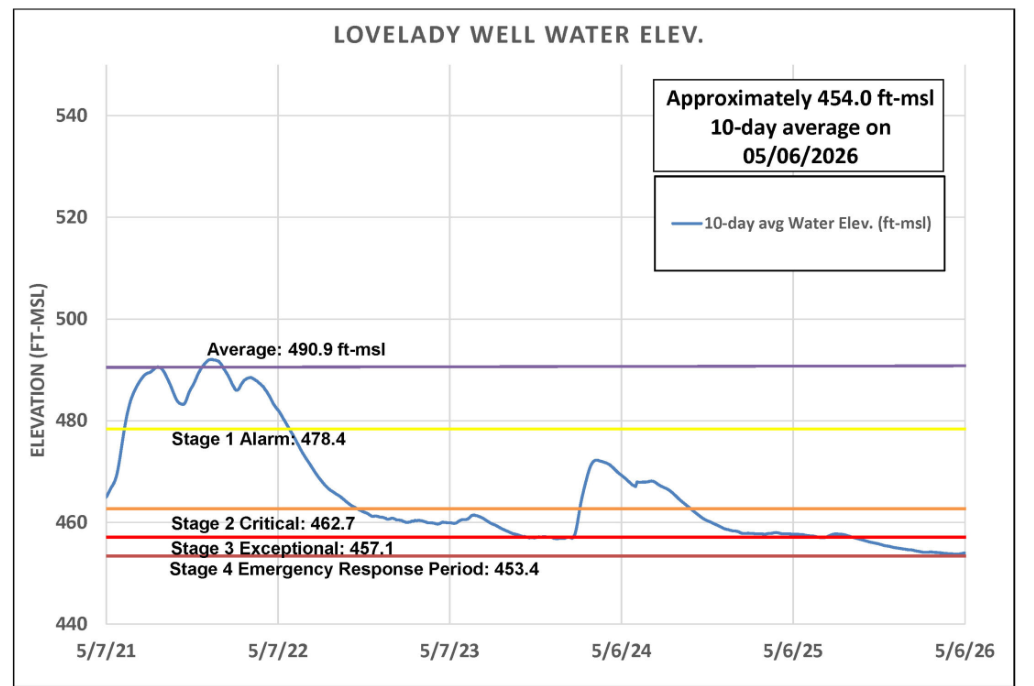
Figure 5. Lovelady monitor well water-level elevation.
Trinity Aquifer
The Lowe-Coronado Middle Trinity monitor well in the Rolling Oaks neighborhood has also shown a positive response to the rainfall (Figure 6). Despite this improvement, water levels remain at their lowest on record for this site.
Jacobs Well Spring 10-day average flow as of May 6 is 0.12 cfs. Previously, the spring had had no flow since November 2025. Flow briefly peaked at 1.8 cfs on May 2 before dropping back to 0.01 cfs by May 6. The Blanco River at Wimberley peaked at 22 cfs on May 1 and is now flowing at approximately 5 cfs
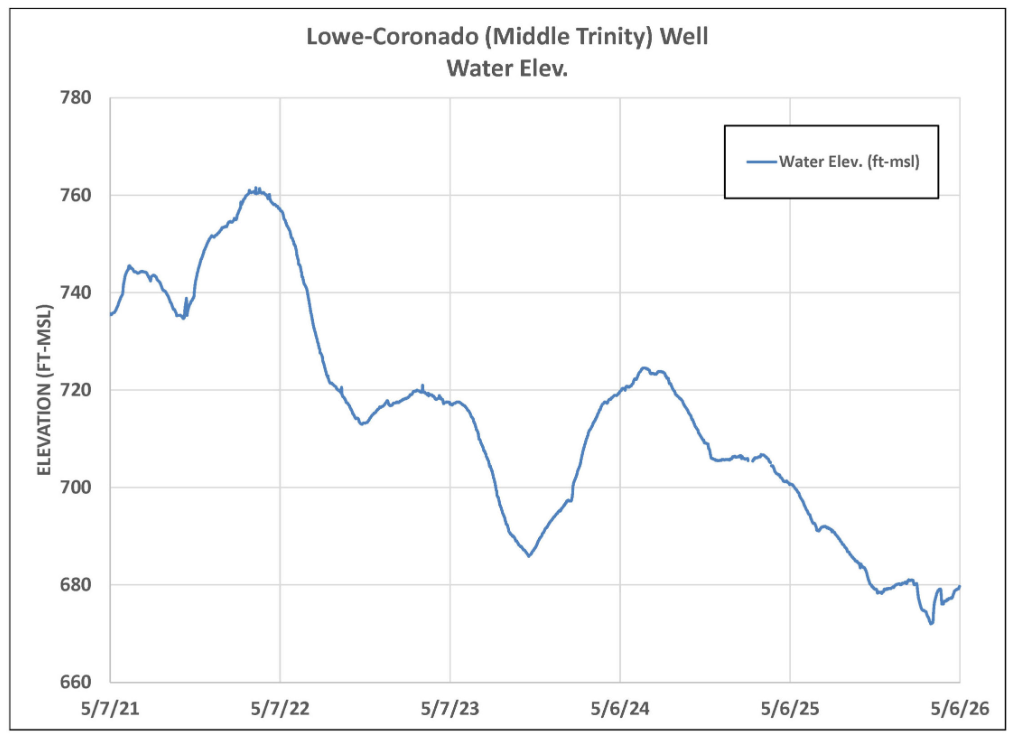
Figure 6. Lowe-Coronado (Middle Trinity) Monitor Well Water-level elevation.
Outlook
The Climate Prediction Center’s forecast for May shows above average rainfall for much of the state. Central Texas has equal chances of above or below average temperatures.
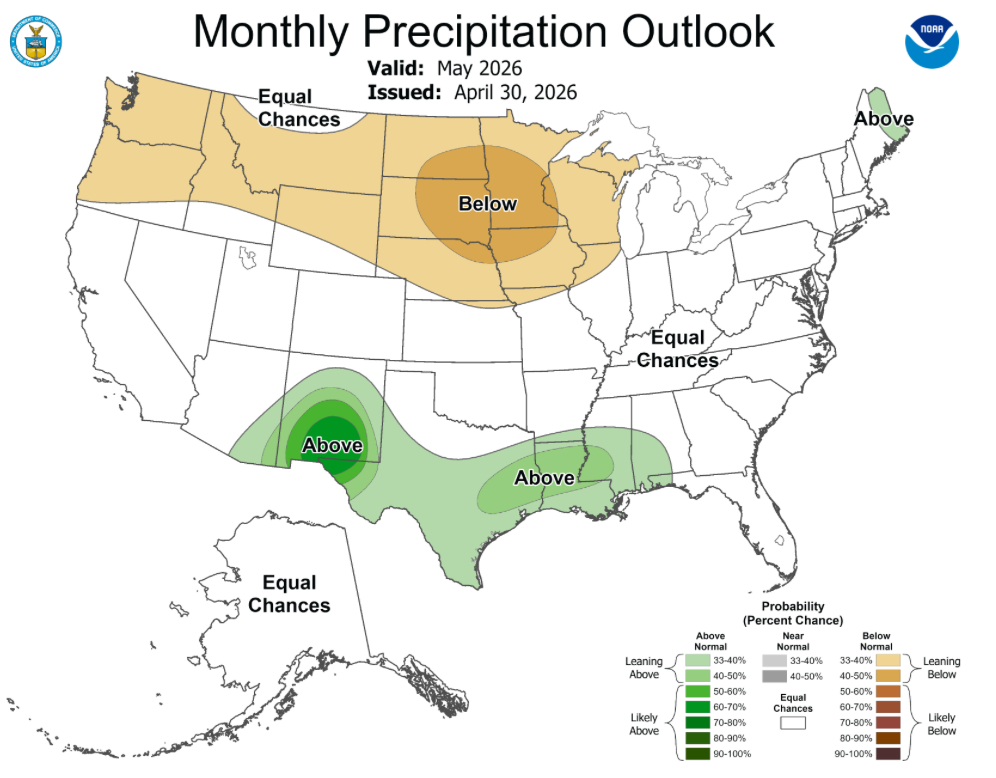
Figure 7. The Climate Prediction Center’s May Precipitation Outlook for May.